Case study · Flagship · 2024—25
Investor portal, rebuilt for clarity.
A self-service platform rebuilt around verified data — so investors could track holdings, access documents, and trust the numbers without calling support to confirm them.
The problem
The issue wasn't the interface — it was the data behind it.
VentureCrowd had an investor portal, but the data behind it couldn't be trusted. Valuations were months out of date, distributions were miscategorised, and totals didn't reconcile between views. The investor relations team became the portal's workaround.
Feedback sessions confirmed it: the complaints weren't about layout, they were about numbers investors couldn't verify. No interface change would fix that. The redesign had to start with the data pipelines, not the screens.
Before a single screen was designed, I ran discovery sessions with investors to map their pain points, and worked with data, engineering, and funds-management teams to trace every inconsistency back to its source — standardising transaction data in Xero, aligning distribution categorisation, and deciding what could be surfaced honestly versus what needed to be deferred.
AJobs to be done
BPain points · investor quotes
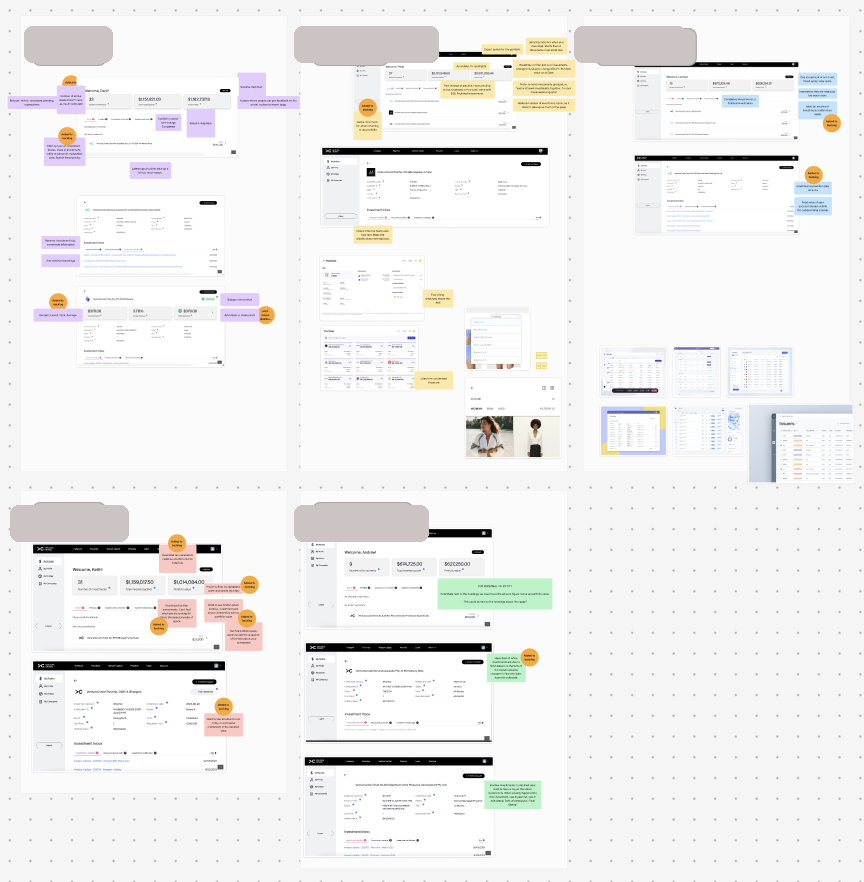
Discovery · finding
Five investors walked through the existing portal and described what wasn't working for them. The pattern was consistent: complaints weren't about navigation or layout — they were about data investors couldn't verify and questions the portal should have answered without a support call.
Key design principles
What to design for, once the data was right.
With the data foundation in place, the design work became about what investors actually needed to do — not what the system could display. The JTBD framing translated directly into product decisions:
- When tax time comes → bulk statement downloads and one-tap email to accountants
- When I open the portal → portfolio snapshot with a freshness indicator on every figure
- When a distribution lands → clear source labelling and next-distribution context
- When I'm deciding whether to reinvest → side-by-side performance across holdings
- When something has changed → status flags surfaced, not buried in statements
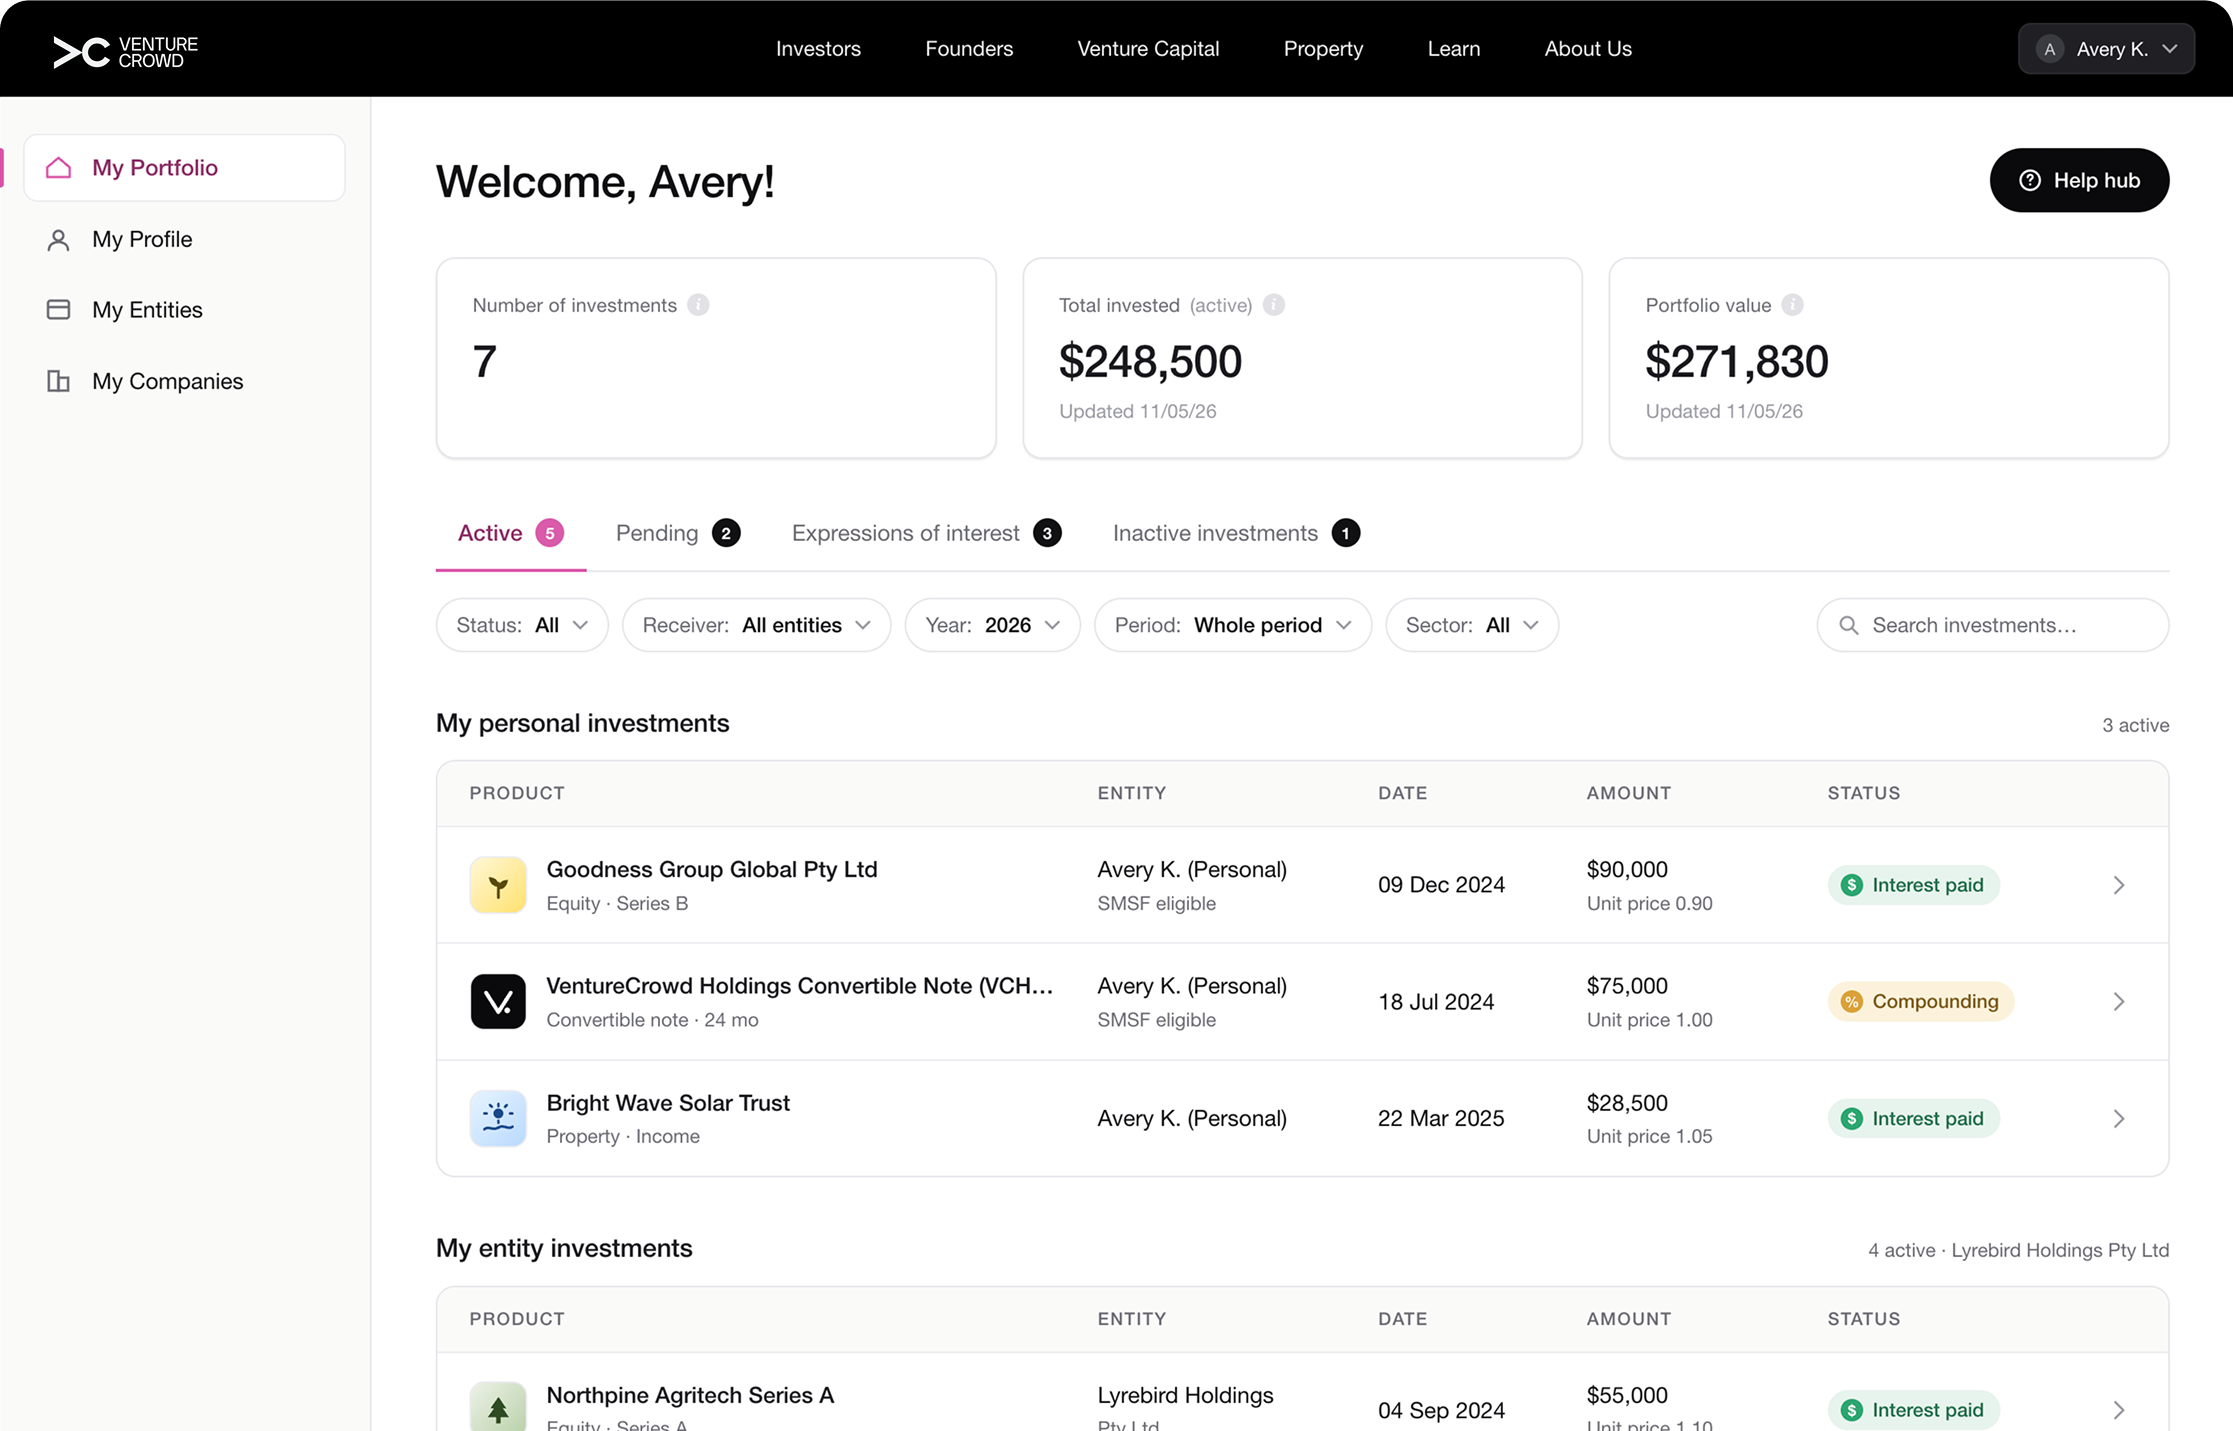
The top-level portal was designed as a portfolio snapshot, not a dense data view — answering these questions at a glance, with detail one tap away.
Portfolio snapshot
Total value at a glance — designed to answer "where do I stand?" without requiring investors to calculate across individual holdings.Investment list
Each holding shows enough to act on — current value, status, and a clear path to detail. No information buried.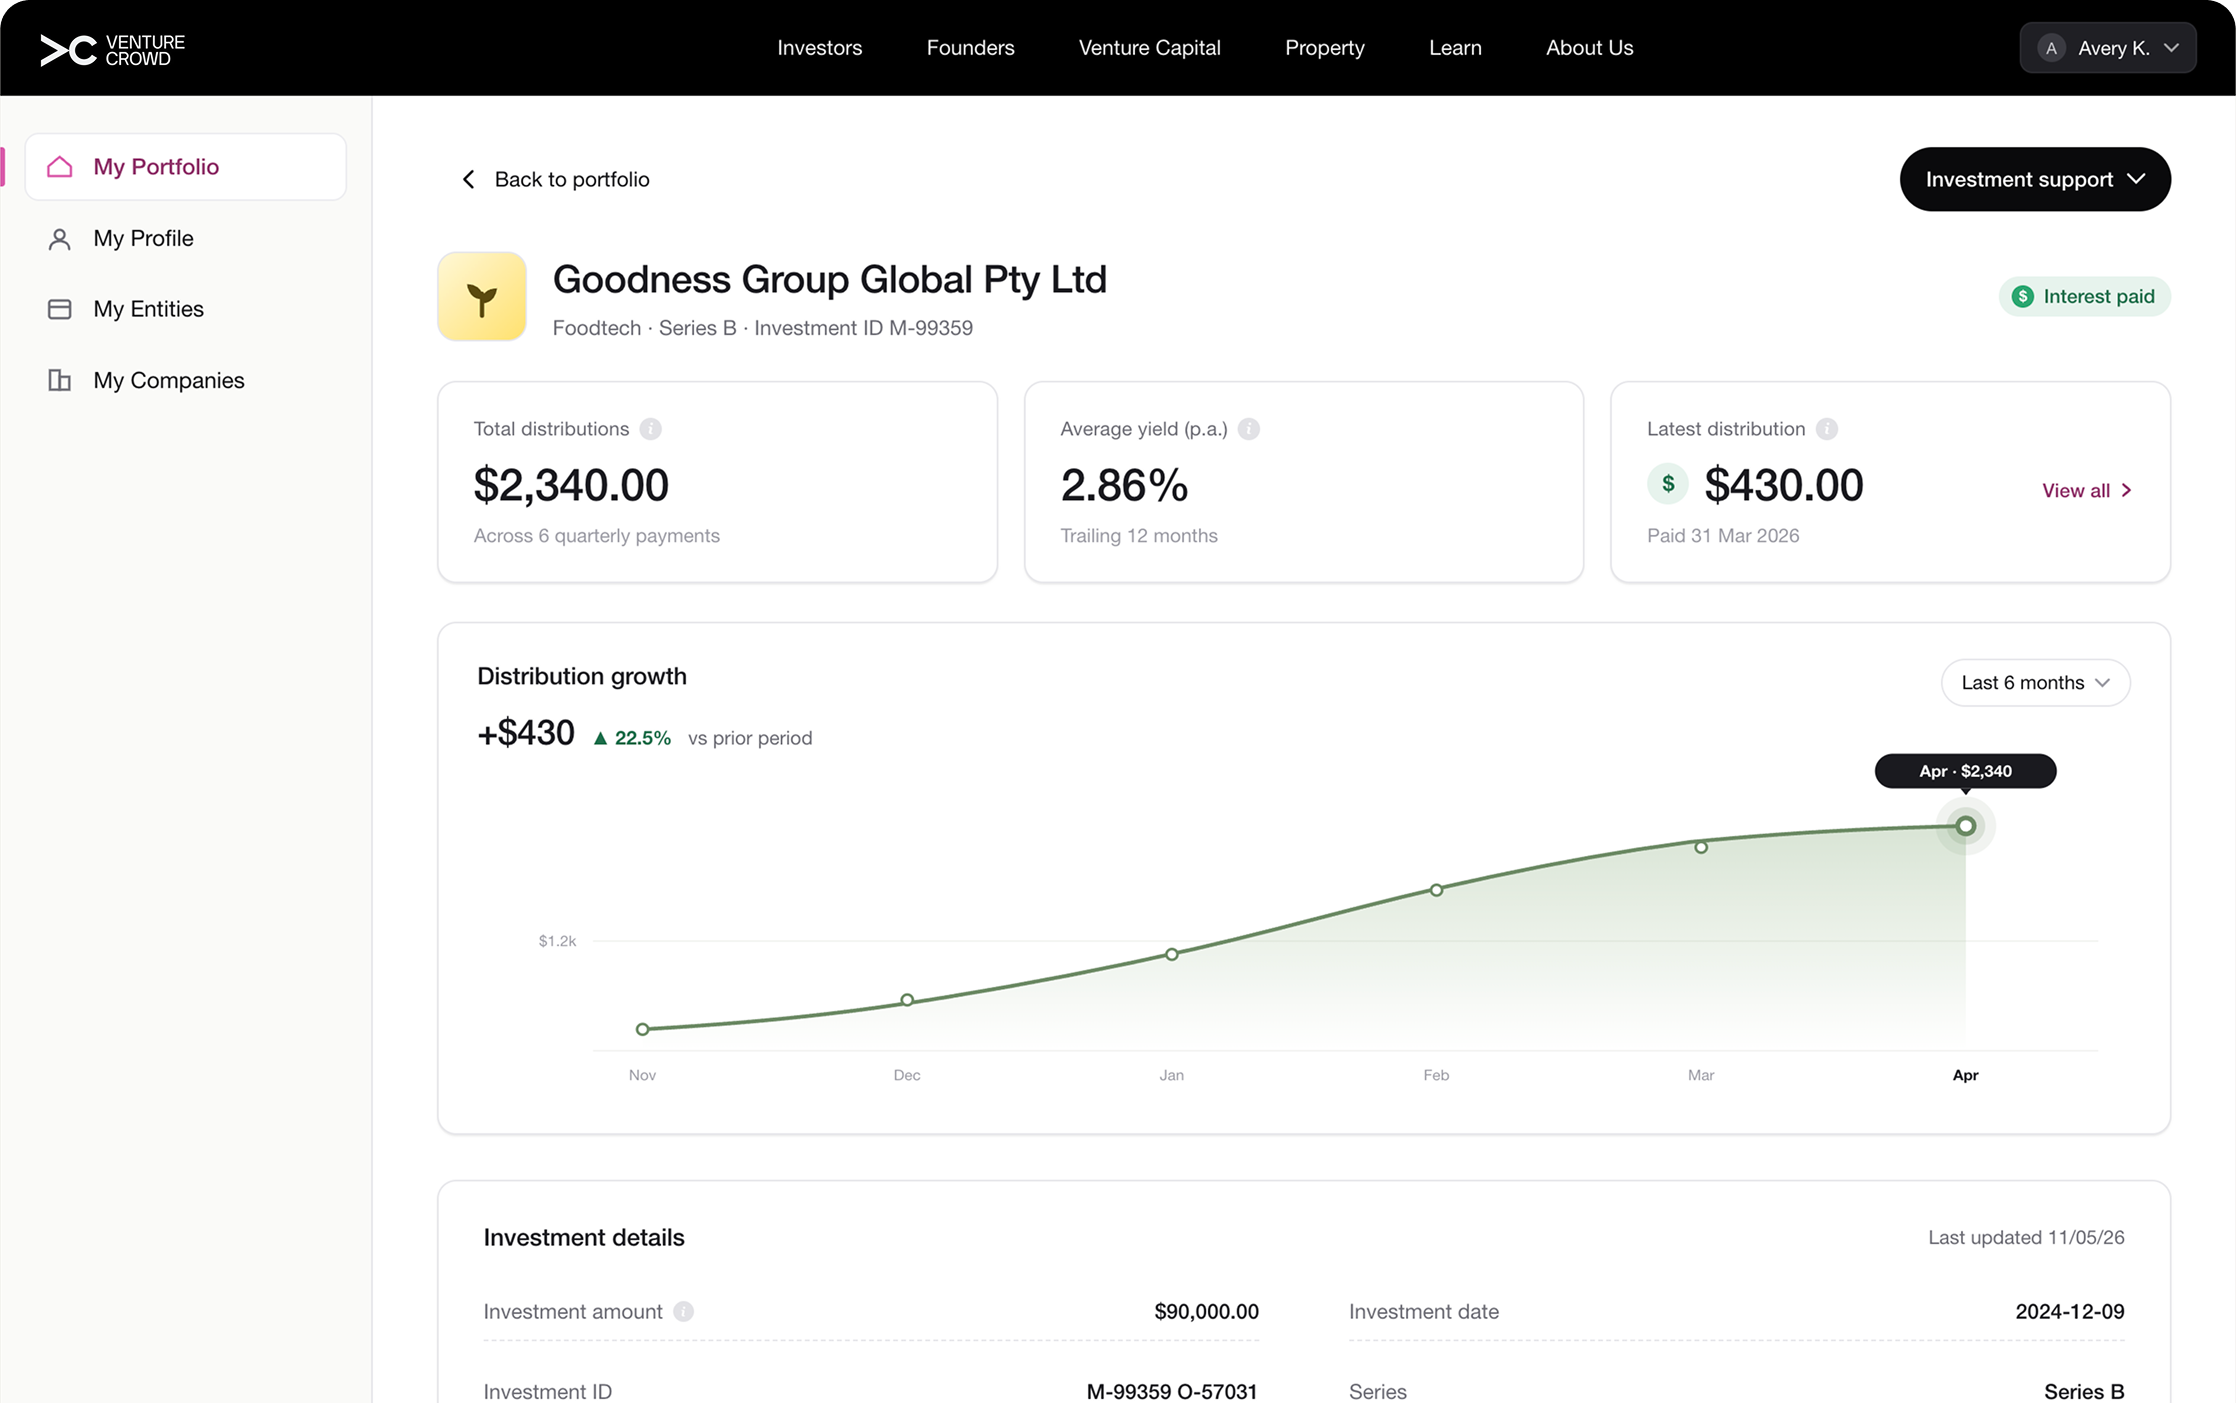
Freshness indicator
Timestamps show when each valuation was last updated — investors see how current the data is, not just what it says.Distribution sourcing
Distribution categorisation aligned with operational records — the same figures investors receive from funds management.Estimated label
Where certainty is limited, values are flagged as estimated — showing less is better than showing wrong.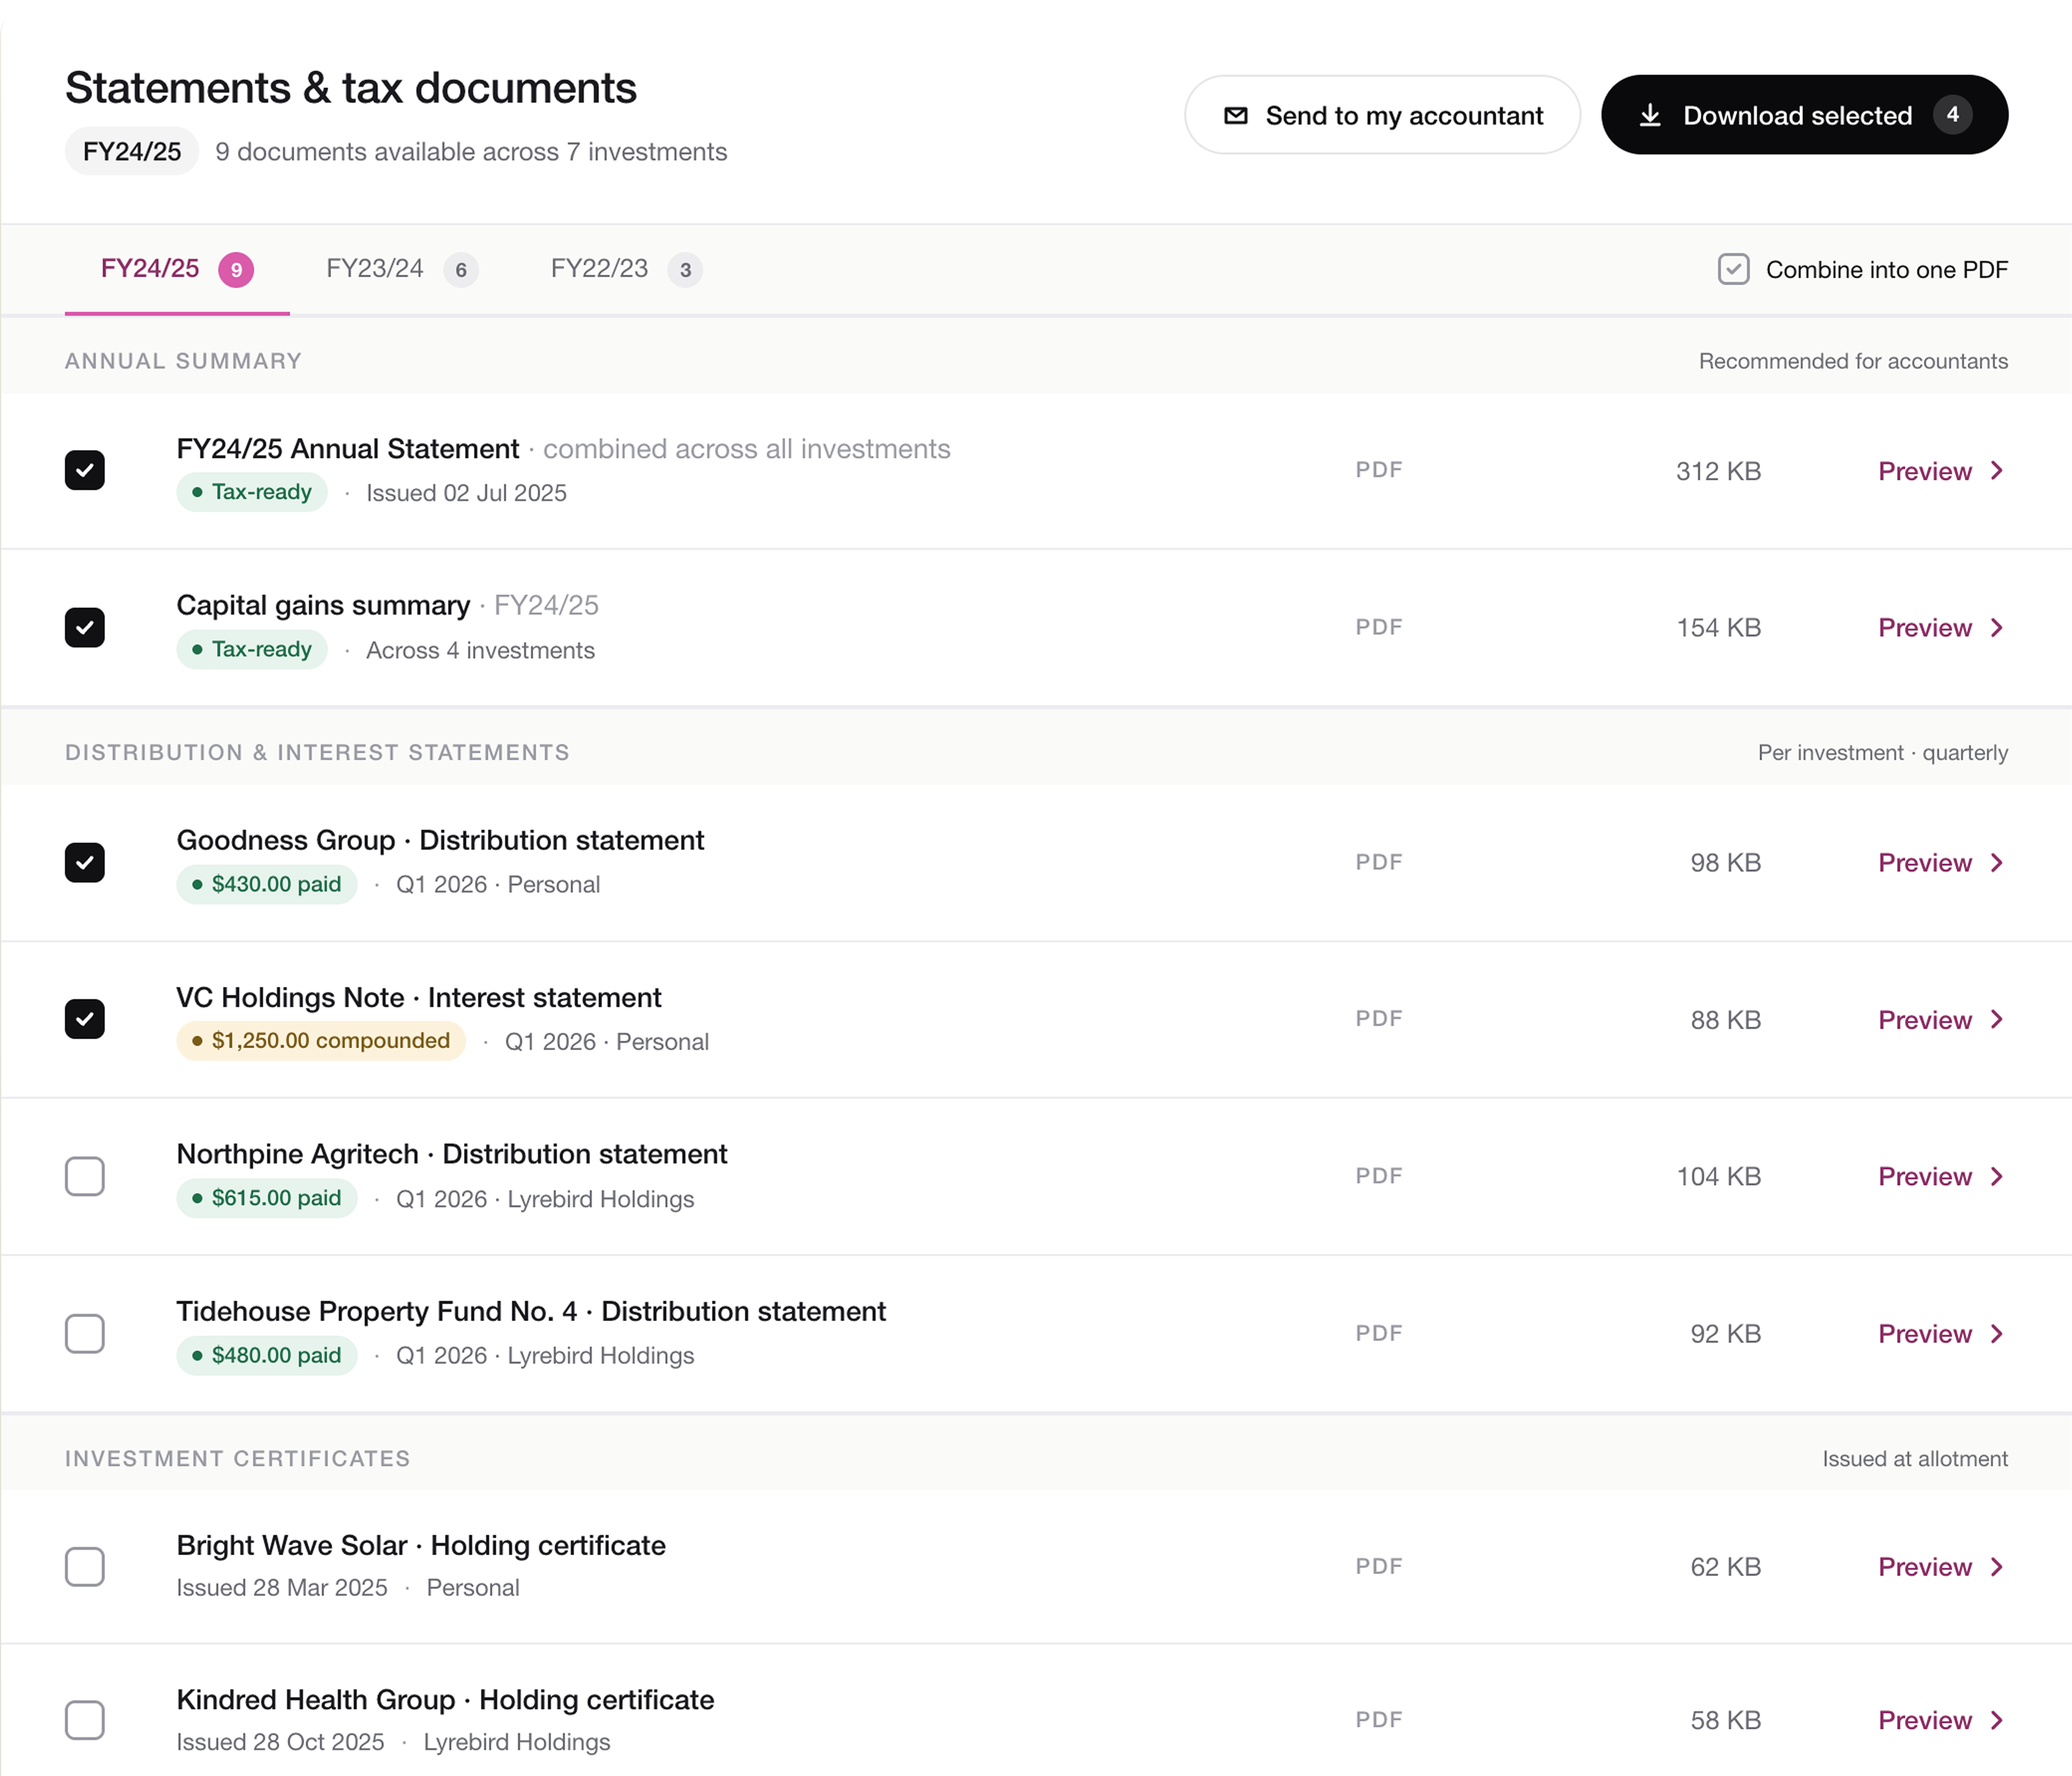
Bulk select
Pick across multiple statements and download as one PDF — built for tax time, when accountants need everything at once.Email to accountant
One tap sends selected documents straight to an accountant's inbox — no forwarding, no manual attachments.Key design challenges
Be honest about what isn't certain.
In financial products, some uncertainty is unavoidable. The instinct internally was to hide it — keep underperforming unit prices off the dashboard, present incomplete data as definitive. I pushed back: an investor who'd already lost trust because of inaccurate data wasn't going to regain it through a cleaner UI.
The portal surfaced uncertainty directly: valuation timestamps, freshness indicators, estimated-value labels, and clear distribution sources. The same principle shaped what we didn't ship — historical distribution tracking was deferred until the data could back it up.
Same experience, smaller surface.
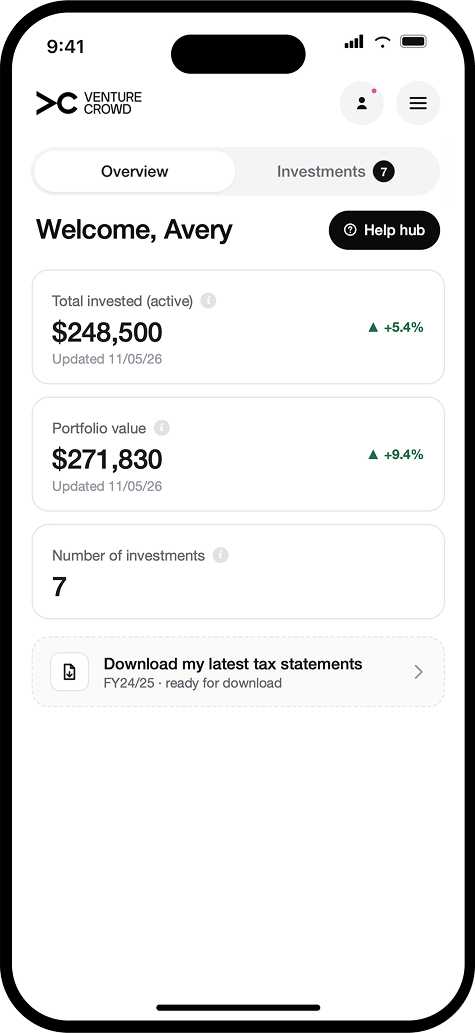
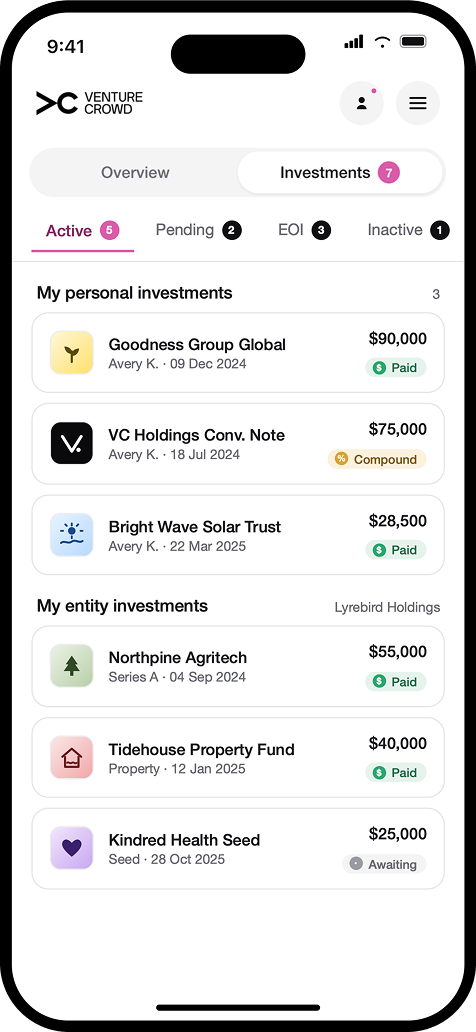
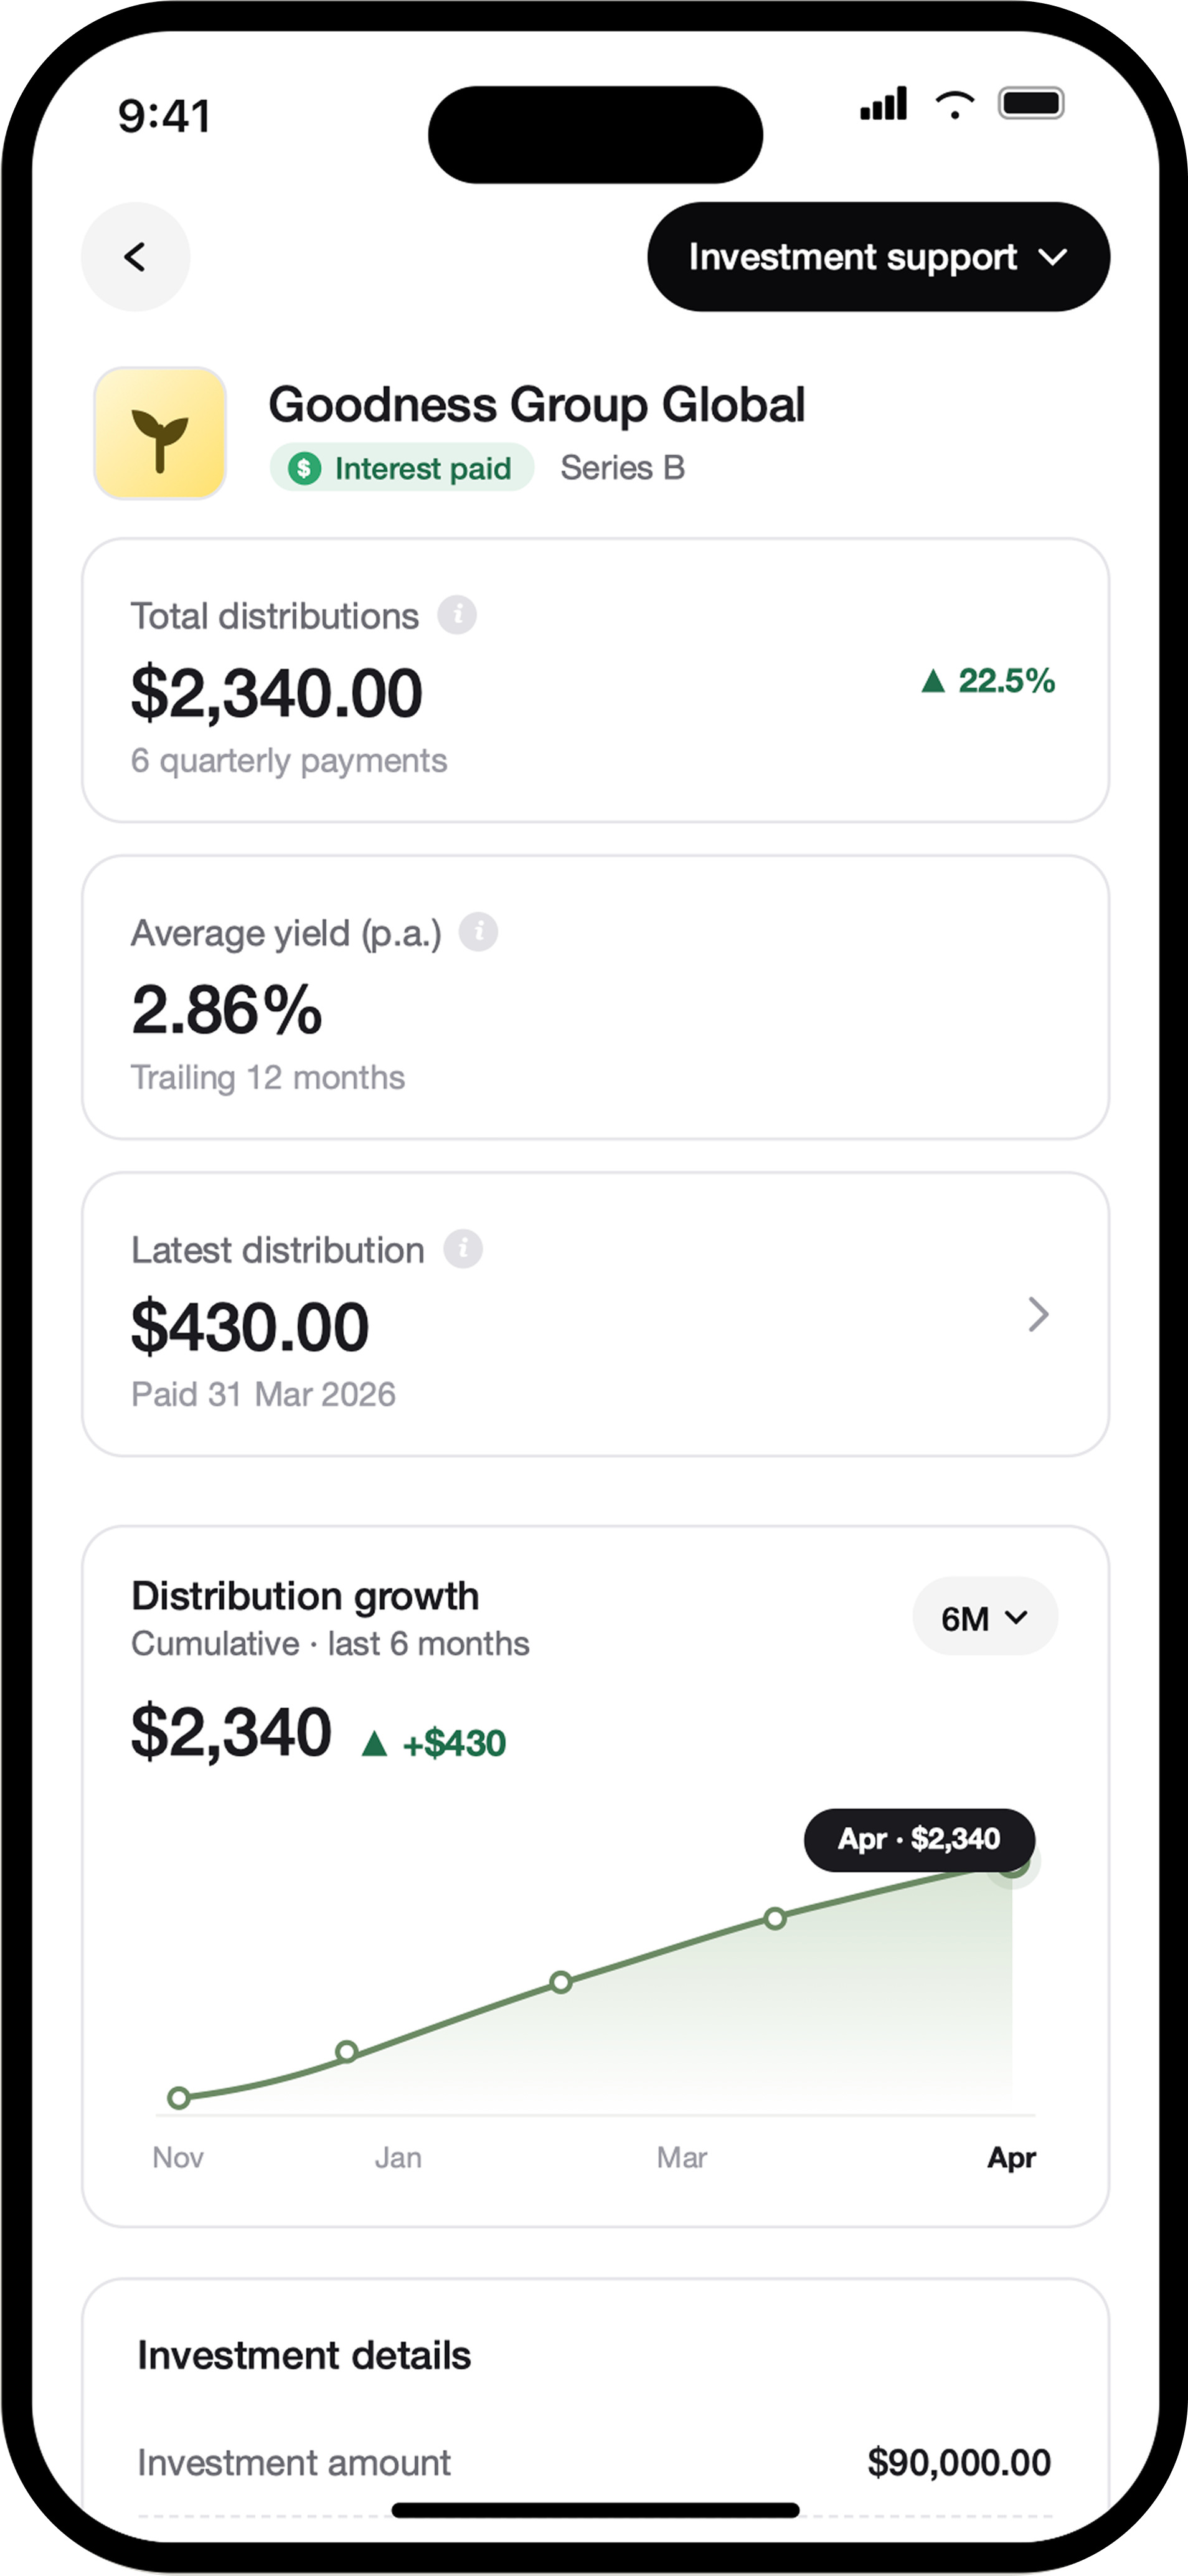
Designing a data-heavy dashboard for mobile wasn't straightforward — portfolio performance, distribution history, and document access all needed to work on a small screen without losing the trust signals that made the desktop version credible. But we knew investors weren't only logging in at a desk. Email updates drove traffic: when a valuation changed or a distribution landed, investors checked their portfolio on their phone first.
The solution was a toggle that split the overview and investments into two focused views rather than one dense scroll. The detailed investment page and distribution graph are separate screens from there — keeping each view focused without losing depth.
Outcomes
What it delivered.
01 · Investor trust
Satisfaction and retention
- Increased customer satisfaction and net promoter score
- Ease of the investor portal cited as a reason investors continued managing private capital with VentureCrowd
02 · Operational efficiency
IR team freed up
- Reduced volume of complaints and support calls to the investor relations team
- IR team redirected to higher-priority work rather than routine balance and statement queries
03 · Platform behaviour
Signals, compliance, and depth
- Portal usage signals feed models identifying data points linked to likelihood to invest
- Bulk tax statement downloads enable investors to meet end-of-year compliance requirements
- Increased time on platform — complex transactions completed in-portal rather than by phone or email